Building an occupancy sensor with a $5 ESP32 and a serverless DB
Have you ever wanted to design a full end-to-end software solution to collect occupancy data across a college campus?
I didn't think I would either, but here we are.
The inspiration
During my first year in college, we had Sodexo as our dining provider. They had a contract with Bluefox, who provides occupancy sensors to report the number of people within a dining hall. I'd like to think they used this data to improve dining hall operations. I couldn't tell you what they actually used it for. I can say that after some FOIA requests a friend made that returned PDF's with awful kerning, these devices work by counting smartphone MAC addresses from Bluetooth advertising packets. This was a pretty cool way for me to avoid crowds in the dining hall - toss the API call into Grafana, and you have a live chart of how busy the dining halls are.
The downfall
Unfortunately, the university switched dining hall providers to Aramark. Aramark does not contract Bluefox to provide the same occupancy counts, which meant no more occupancy data, which meant no more skipping busy hours.
The climb back
The idea of tracking occupancy metrics with a bluetooth beacon was stuck in my head. What design decisions and considerations would you need to make?
- How accurate is BLE beacon count, as a proxy for occupancy?
- Some people carry around headphones, smartwatches, etc - but some don't carry any devices at all (or keep Bluetooth off on their phone).
- How accurate is BLE beacon availability time, as a proxy for dwell time?
- Can we use unique MAC addresses' churn to detect this?
- Is the built-in MAC address randomization that is common across many different manufacturers going to impact this? (Even though this privacy feature has flaws)
- How can we communicate the results back to a central server?
- WiFi seems the obvious choice for me. Not every location will have easy-to-access WiFi, though.
- LoRa could be an option, depending on the distribution of beacons. Here's some range testing numbers, though this is affected by the antenna's gain and locations (here's another test with a far higher range).
- How can we collect the data?
- Should we use a time series database?
- How can we analyze the data?
- Can we predict trends in the longer time spans, excluding special events like homecoming weekend, finals week, etc?
I found these questions tumbling around in my head, so I began with some preliminary testing - writing some simple code to count the number of devices detected on my laptop's Bluetooth adapter. Success - it was surprisingly easy to write code to scan for x seconds every y seconds and save it to a SQLite database at regular intervals. So, I carried my laptop to dining halls, Chick-Fil-A, Starbucks, etc and waited.
And waited.
And waited.
I spent a lot of time collecting data while sipping on coffees and milkshakes. You know, for data collection purposes. This is all very academic, of course.
No other reason.
Anyway, accuracy - In smaller areas (like a single-room Starbucks), I found the count to be pretty accurate. At the very least it reflected trends in occupancy very quickly. When more people arrived, the charts quickly climbed.
In larger areas like dining halls, the counts seemed accurate by my guesstimate. There's no way for me to count everyone in a dining hall, with complicated layouts and different seating areas, especially when I'm not certain of my bluetooth adapter's range (is it picking up people on the terrace through the walls? etc). But it most definitely matched the trends around class changes - when classes got out, people went to eat, which rapidly increased the number of people I saw, and the number of beacons my laptop detected.
Long term deployment
Okay, sounds great, it looks like we have some kind of method validation. But I don't plan on cloning myself in every dining hall and sitting 24/7, so what can we do to create a small device to collect the same data?
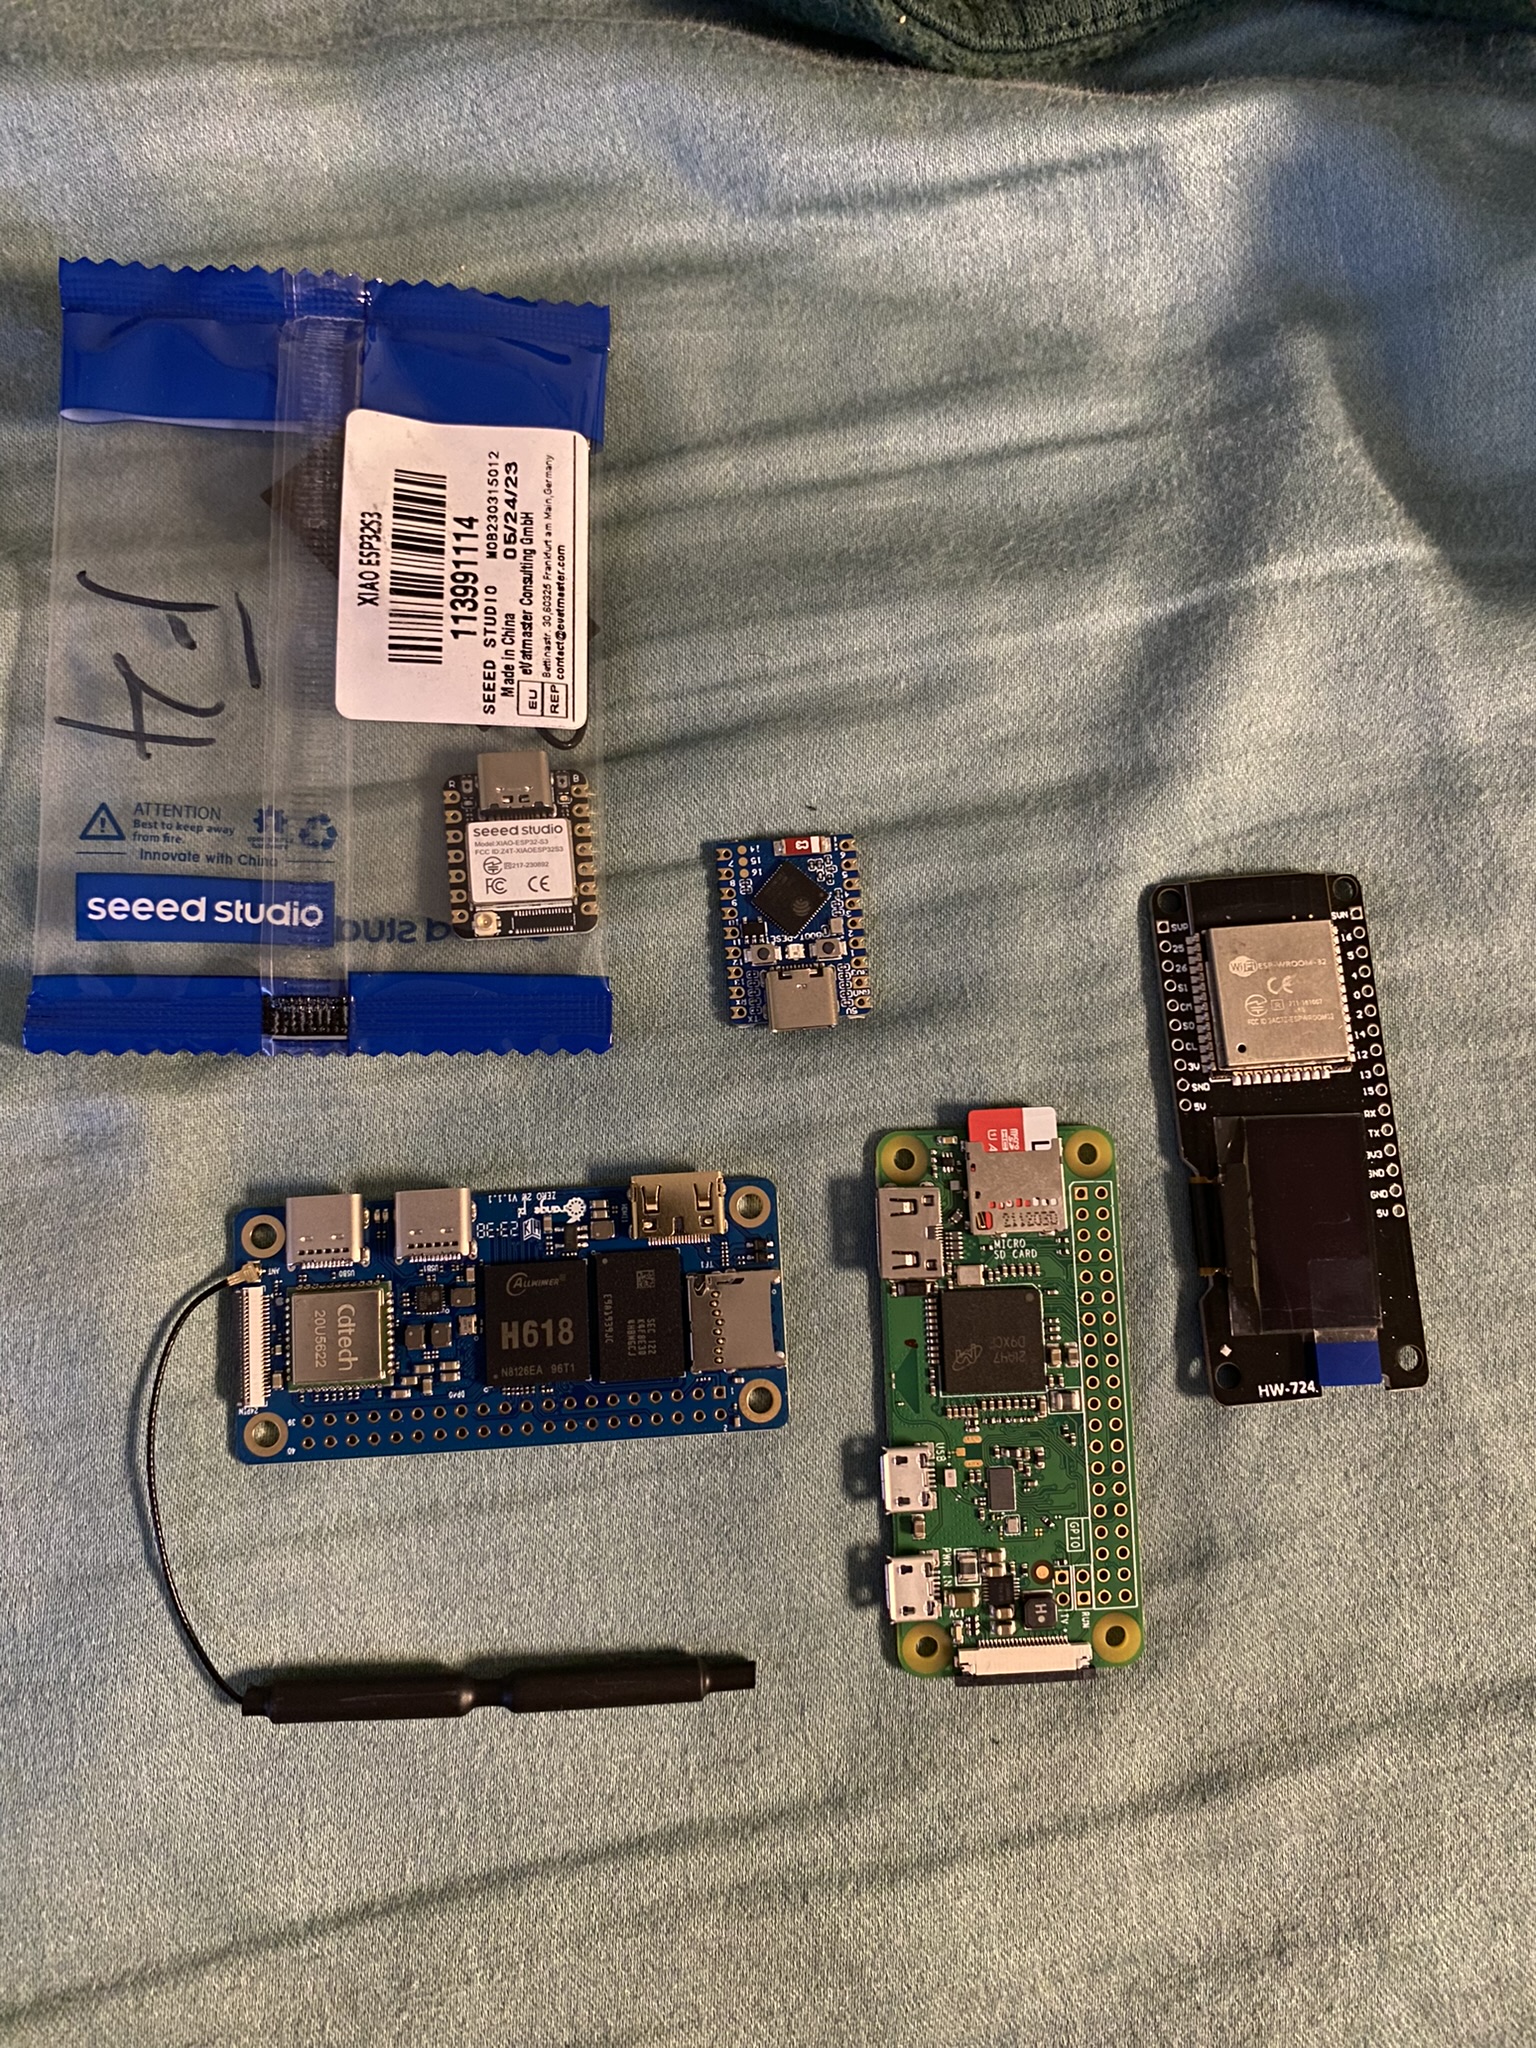
Raspberry Pi - Maybe?
My first thought was - Raspberry Pi Zero W. It's small and cheap, has Wi-Fi and Bluetooth, and definitely is in stock somewhere on Earth.
I rewrote my simple code (in Rust, no less!) to handle everything gracefully (reboots, no network, adapter loss, etc). Linux Bluetooth is incredibly painful to handle in a headless way. Binding to DBus requires cross-compiler magic and not even Cross was getting me out of it. After struggling enough through a million different compiler flags, a power outage that caused me to lose my progress on the Makefile (also, yes I use Make with Rust), and at last setting up a QEMU bridge, I was able to get my binary to run on my Pi. I even wrote all of the patching magic to make it connect to Wi-Fi (try doing THAT headlessly, when there's a portal you have to sign into!), install the necessary libraries on start-up, make a service to run my executable, and automagically update when I push a new update. Okay, that's a lot of moving parts. Let's boot it up and hope it works...
Nothing.
That's right, absolutely nothing worked. Not even the automagic wifi connection via Mac address fiddling hacks.
Moving on
If you're smarter than me, you may have realized that's a bit WAY too much complexity. We really do not need a whole Linux kernel at all. We need two things - reliable Wi-Fi, and reliable Bluetooth. Okay, so shelve the Pi Zero W and Orange Pi Zero W I bought. What's this nonsense about a device that can do these two things at an even cheaper price and smaller footprint?...
ESP32?
On paper, it looks great - Wi-Fi, Bluetooth, extremely low power usage (🌱🌍♻️🌿🌞💚), very cheap, and very tiny.
I purchased one off of Amazon since I didn't want to wait for overseas shipping (not losing momentum in a nerd snipe like this is CRITICAL). I bought a random ESP32-WROOM-32 with an OLED display, since I thought it would be cool to display the data on the screen live. I rewrote my data collection code in C++ form (away from Rust!) since the Rust ecosystem for ESP32 is not all the way there yet.
After fidgeting with the display code enough to get it working (SSD1306Wire display(0x3c, 5, 4); if you're wondering), it worked great. I asked campus IT to whitelist the MAC address, wrote up some Cloudflare functions into a D1 database as my data ingest, and set out to work.
Deployment
I hid placed my data collection device in my campus library on a crisp fall morning, sat myself down at my laptop, saw the data rolling in, and did a silent celebration. Off to my Principles class to learn about scope rules then...
Obstacles
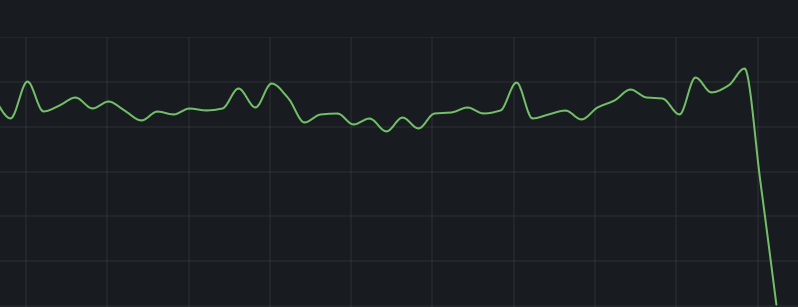
One major problem that I ran into was the poor specs of the random ESP32 device I had.
The above issue shows the device crashing at about 250 devices. At first, I was worried this was a bug with the result count being stored in a 1-byte number, like a u8 (thus capping at ~255 devices). A quick Serial.print made me realize it would crash also at about 249, 265, etc - randomly around this area. So, not a bit-overflow issue (at least, not in the integer part!).
Our library fills up quickly with studious twamps - it wouldn't last a minute in finals season if it couldn't handle any more than that.
The problem - identified
By saving the results during a scan into a data structure until the end of the scan, it piled up data about the device's scan strength, advertised services, manufacturer ID, etc. While this seems like great data to collect, I had one thing in mind - the number of unique devices (for now).
By debugging the heap size constantly, I realized that the scan results was filling up the small amount of RAM it had. This was bad news - at first, I didn't see a way to still collect the data while not actually collecting the data.
Resolution
I decided to brush up on my C++ data structures programming and write a small hashset. After all, the data structure for the scan results was very bloated - if I could override that, I would be able to control the heap size more closely, right?
On every callback, then, we'd insert the MAC address into a hashset, then clear the built-in result structure to allow for more memory.
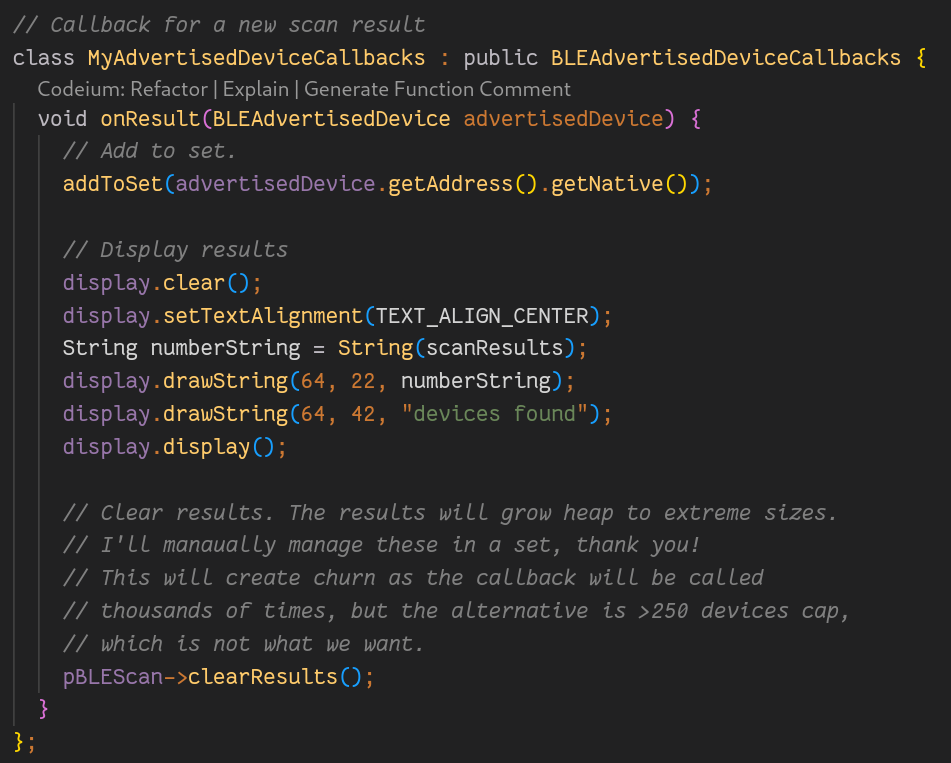
Unfortunately, this is not ideal - if and only if there's some results to check for duplicates, the callback is only called on new devices. When we clear this every time, we give it amnesia, thus every single BLE advertisement packet causes a callback. We do check for duplicates in addToSet (it is a hashset!), but this will definitely cause hundreds of duplicate callbacks to our hashset, and heap thrashing since we're allocating and deallocating the result structure every single callback. That's okay (for now), it's better to repeatedly check a hashmap with no more than 1000 entries (a very quick procedure) very often, than have our capacity limited to 250 people.
More obstacles
Okay, we now have a perfect way to scan for devices for long periods of time. Oh would you look at the calendar - it's fall break! I'll leave it in the library and have it report back so I can see how packed it is over break (yes, there will be studying done on campus over break - we are a nerdy college). Perfect, even some long-term testing over the 5 day weekend! Surely nothing bad will happ-
Okay, awesome. Another issue, one that manifests itself after 3 hours of use with zero indication of issues. After fighting with the debugger for long enough, and even tossing in periodic reboots (it boots very quick so this adds almost no time at all), I chalked this up to a bad board/BT adapter - it seemed to run, but it instantly returned zero devices on every scan. That's okay - while I was messing with this Amazon one, I bought quite a few others, along with the rest I've bought over the course of the whole project.
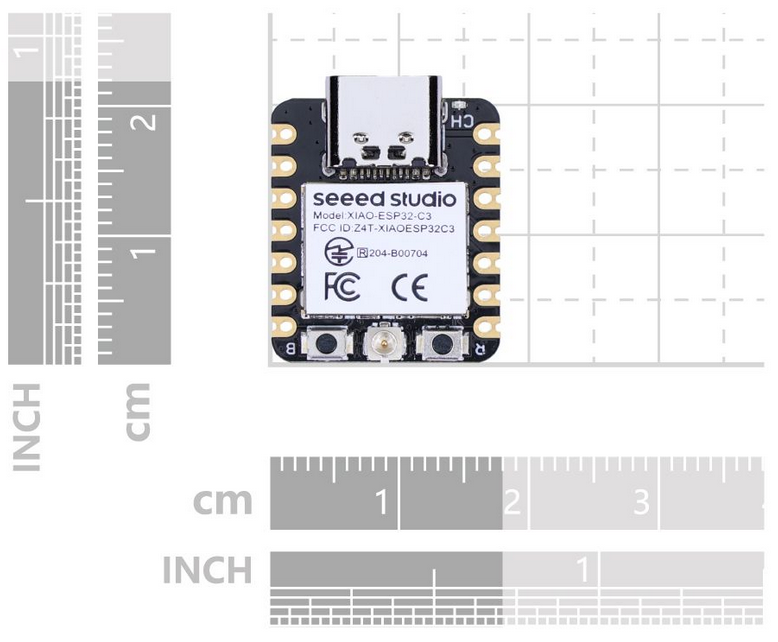
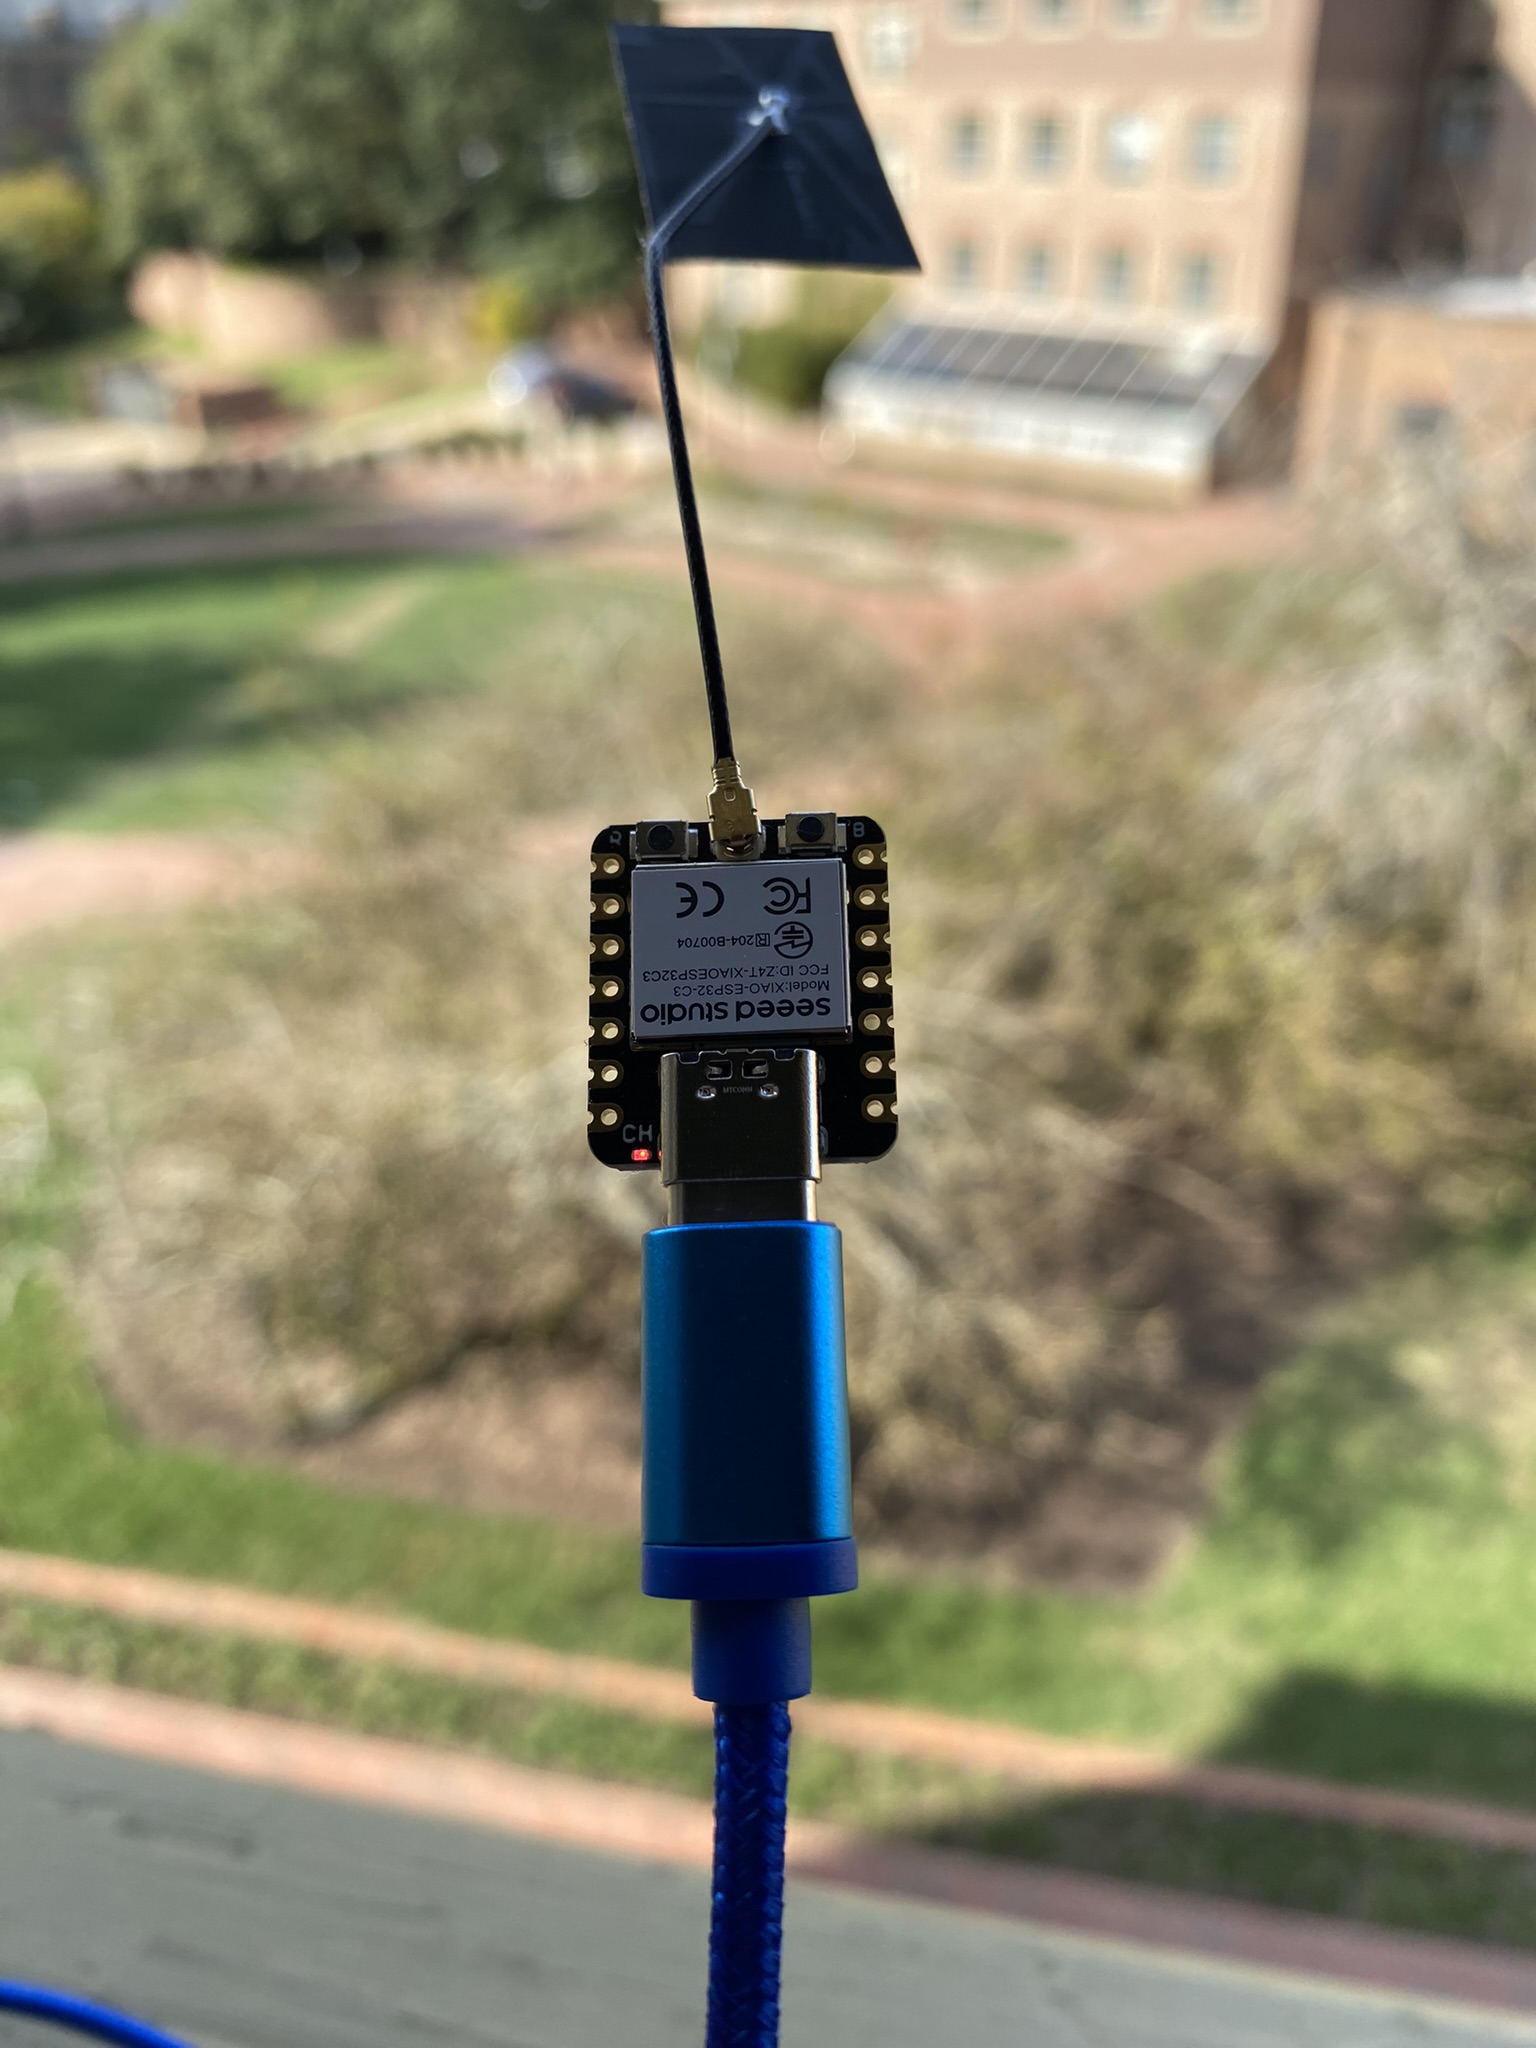
After testing all of these, the only one reliable to work for long periods of time (one month currently) was the XIAO ESP32C3/S3. Both work acceptably, but I decided to go with the C3, since it's RISC-V, which is awesome (for my ideals), and since it's cheaper, which is also awesome (for my wallet).
Another benefit of switching to a better manufacturer is more SRAM - I was able to switch away from my hand-written hashmap implementation, since the RAM was able to hold the results data structure much better without crashing. I've seen as high as 1000 devices detected with no sign of slowing down. This probably reduces CPU usage as well - no more heap and callback churn!
After I found a device that worked far better, I moved my deployment location to my dorm room window so I would have an easier deployment cycle - here it is with numerous academic buildings in the background.
Final data collection
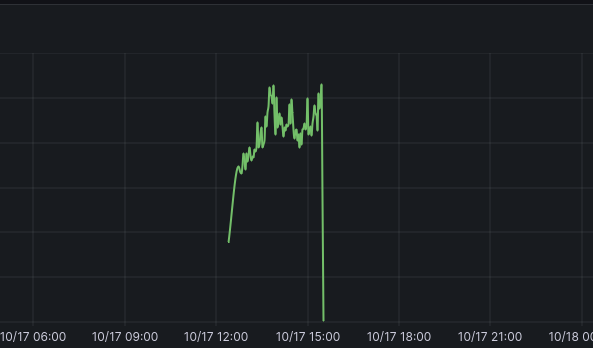
Now that I've gotten my data collection working successfully, let's look at the data for one day.
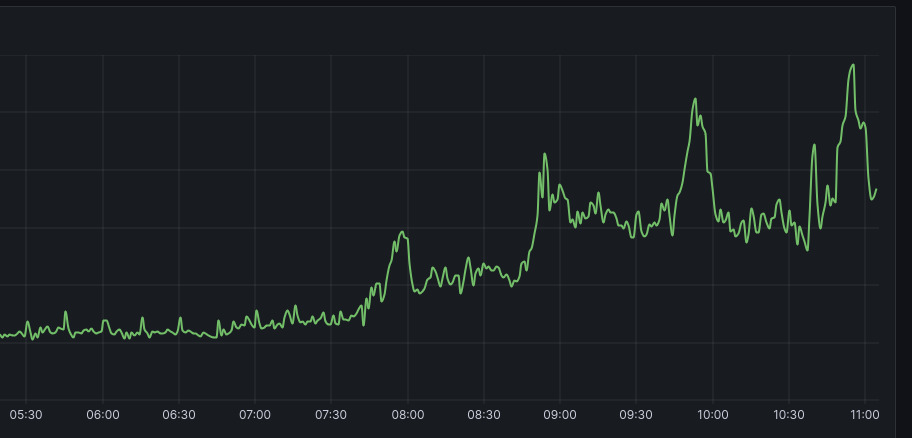
There's something to note about this. The device might be in my dorm, but it largely is not limited to the dorm's own inhabitants. Otherwise, it would be at its max in the early morning and drop as the day went on. If I wanted it to measure exclusively dorm inhabitants, I would probably place it more centrally (instead of out a window), but it still would not be great at this, since dorms are the worst at permeating bluetooth signals through many walls.
That's okay, I'll just keep that in mind as I analyze the data - it's mostly picking up students as they go into the two nearest academic buildings, not the dorm inhabitants.
The peaks start up around 7:50, right before the 8 am classes start in Ewell and Washington halls. I suspect this is detecting the students initially leaving dorms, shuffling along to their classes, and the drop is as students enter the buildings. Then, the peak at 8:50 is probably as students leave their 8 AMs and go to their 9 AMs, entering the range of the device only to immediately leave it as the numbers drop at 9 AM. Same for 9:50/10 AM, and 10:50/11 AM. These are all class switch times.
These all point to method validation - it seems like this device really is good at tracking trends in the movement of students around it. The antenna is also seemingly very high range - I didn't expect it to reach the ~160ft into Washington Hall, and the ~100ft into Ewell. The altitude of being on the 3rd floor probably helps with it, though.
Time series forecasting?
This seems like the perfect target for time series forecasting, like with NeuralProphet. The data is chock-full of hourly, daily, and weekly trends. I added the functionality to predict these trends and so far, it's very good at predicting daily trends; the longer (week, month, and season-long) trends will likely converge after enough data is collected.
Further thoughts
Of course, this is not a solved project. I've written the code to parse this into a Cloudflare DB, into Grafana, and some forecasting, but there's more to be done.
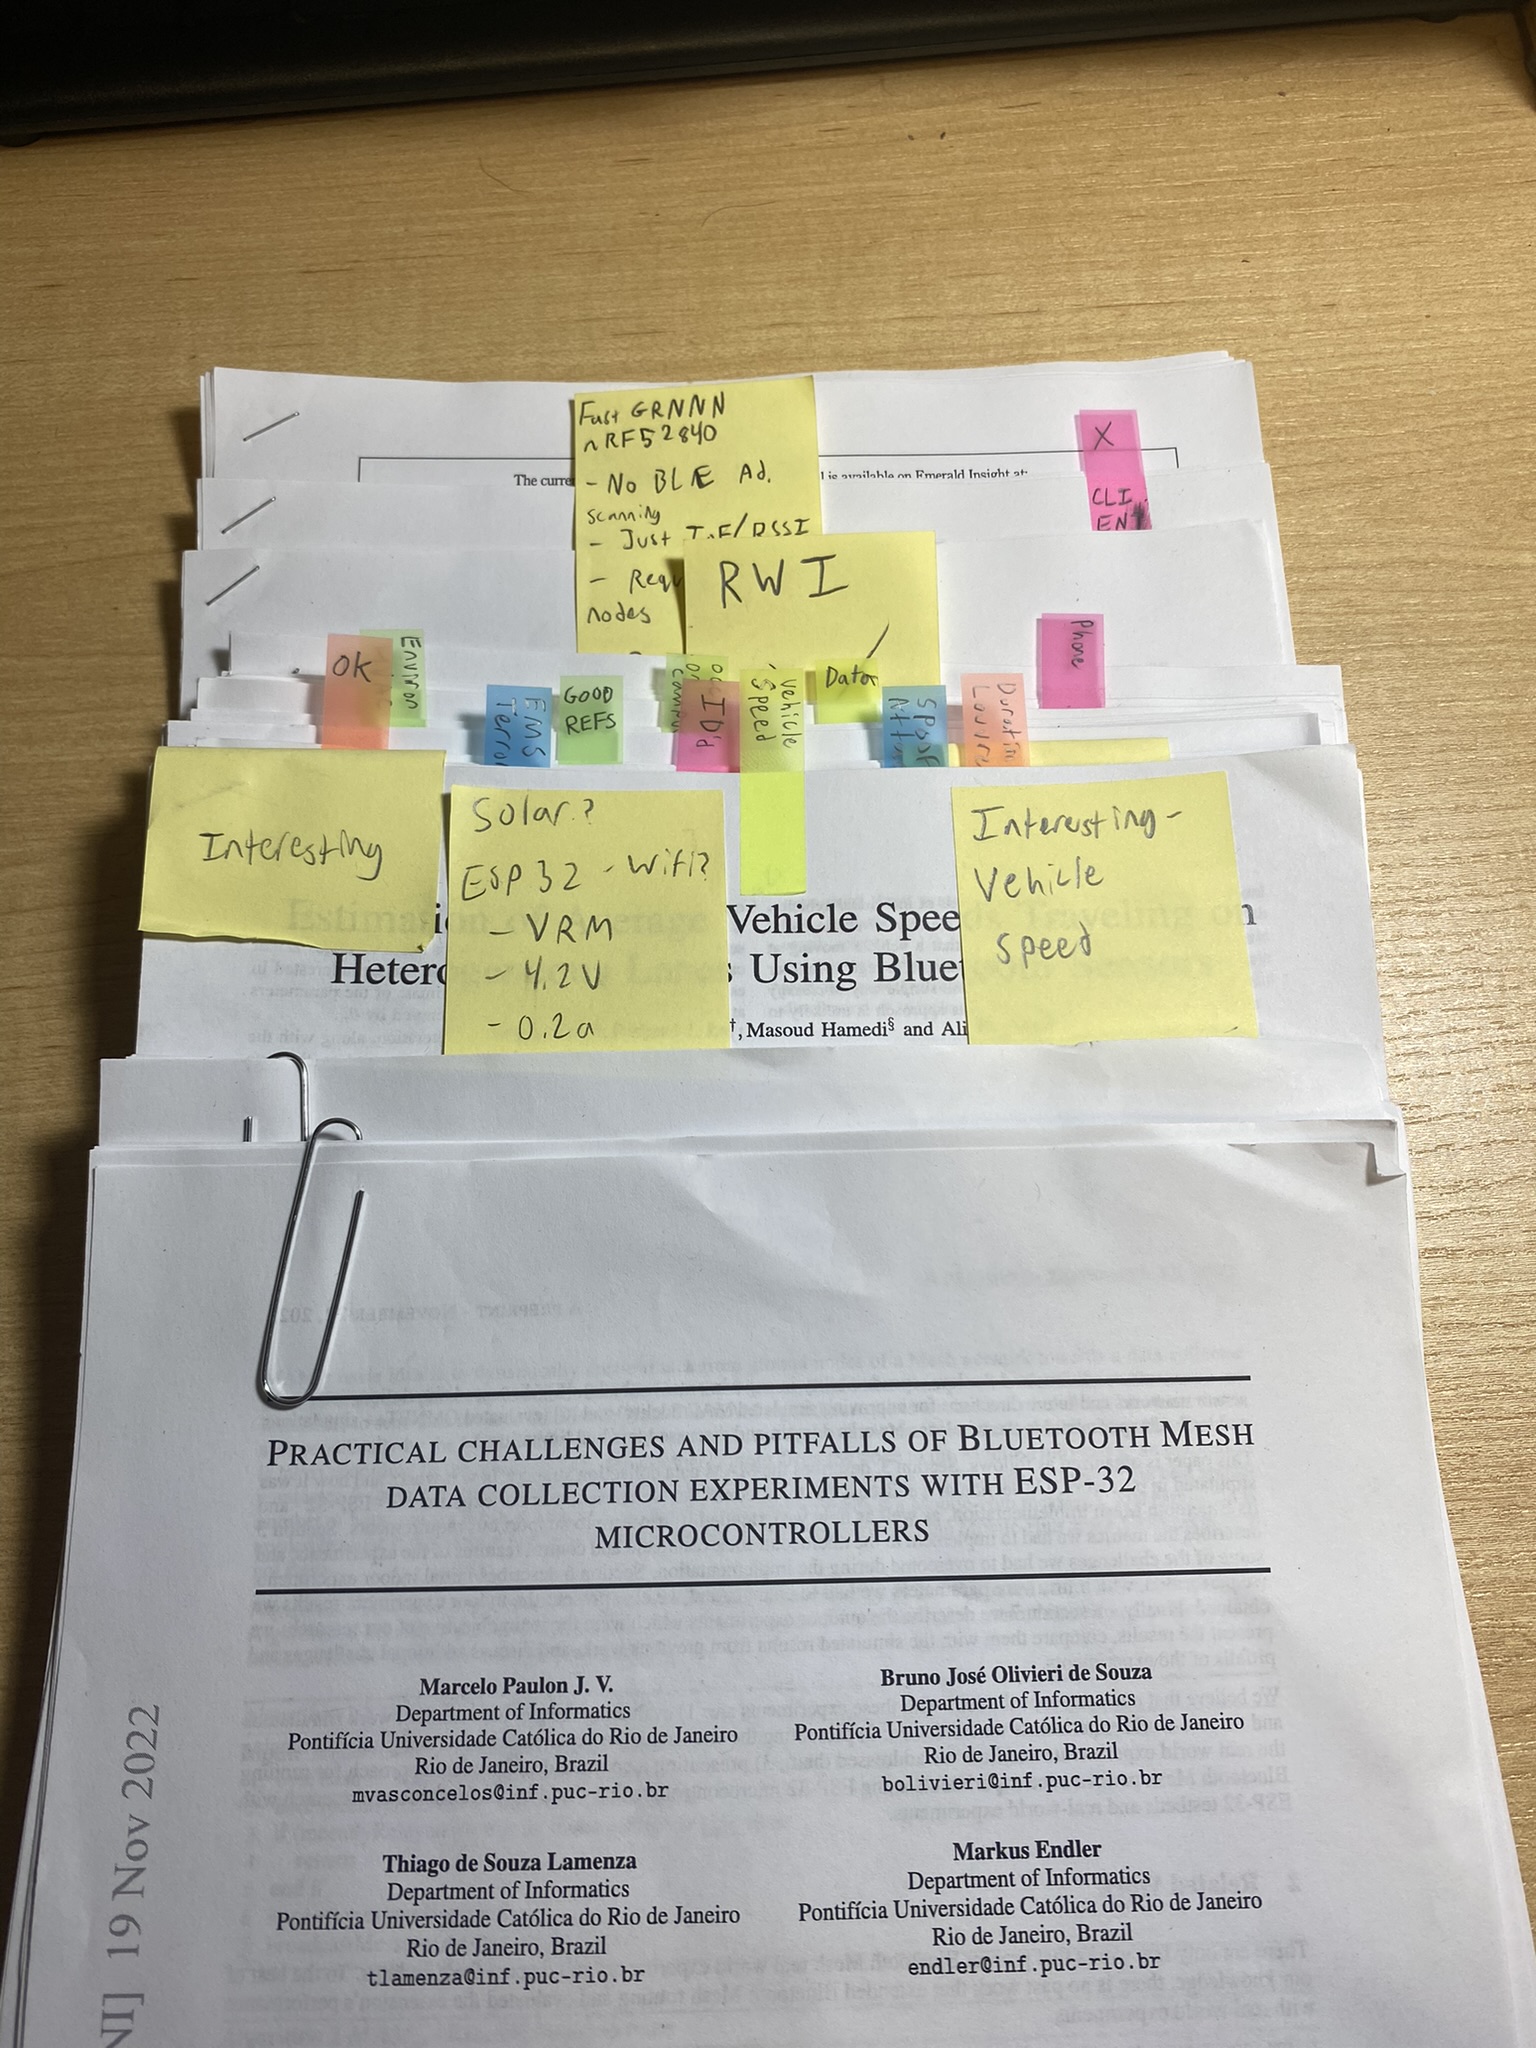
I performed an enormous amount of literature review over the course of this project - reading dozens of research papers on the topic, finding out what works and what didn't, what I would try and what I would avoid. Many questions are raised in these papers, that I still want to answer.
For example, how well of a proxy is a BLE beacon count for actual population count?
- Does this depend on the demographics? How do we find a correction factor (like for
xbeacons, there's roughly0.7xpeople, given the multiple devices people carry around)? - For example, in the computer science building, is the linear rate to population higher, since we carry so many gadgets around? Or is it lower, because we know to turn off Bluetooth when not using it (BT firmware zero days, you see)?
- Or in the staff building, is it lower compared to students, since they are less likely to carry around a bunch of tech?
- Maybe the rate is lower in a dining hall, since not many people are using multiple devices like they would in a lecture hall (laptop, iPad, etc for notes)?
Other questions came to mind, like:
- Can we improve the accuracy by setting an RSSI minimum, for which devices weaker than it do not count, to ensure only those who are really nearby get counted?
- Can we improve the accuracy by filtering by manufacturer ID, so it's only Apple + common Android manufacturers? Would this help, since Apple Watches, AirPods, MacBooks, etc would all still add to the count?
- What kinds of privacy accomodations do I need to keep in mind? I already only track pure beacon numbers. I don't track actual MAC addresses like Bluefox did, but do I need to add noise to the data? Is the existing data noisy enough to avoid deanonymization? Is it realistic to identify a single person in the data without anything but the number of devices?
- What's the best scan duration? Too quick, and it won't find all of the hundreds of devices that exist. Too long, and we risk inaccuracy (counting devices that have since left, data showing large drifts within short periods of time, etc).
- Is a dynamic scan length best? (Think about cooking a bag of popcorn - when a period of time passes without any change, you're done)
Lots of questions to answer. I plan on validating my data with real-world population data collected in a place where it's easy to get the "ground truth". Maybe I will reach out to a place on campus who either already tracks occupancy (the gym with swipe in/out), or will investigate more thoroughly in a place where it is trivial to do so myself (limited entry/exit, like a dining hall, or a Starbucks).
Further work
I am not sure whether I will be taking this further - I'm currently talking to some professors about the use cases for some university committees, or perhaps further academic (and hopefully publish-worthy) research. I am also considering selling it to brick-and-mortar businesses that want to measure occupancy trends. It's a pretty packaged up solution - everything from the front-end to the back-end is built already. This is vaguely what the setup looks like for any given deployment:
- Set up Wi-Fi in config (either have network whitelist the MAC if it's a portal, or connect to open/password protected Wi-Fi on boot)
- Change machine and site IDs in config
- Plug device/devices into outlet in central/convenient locations
- Set up Grafana dashboard to read each device from backend
- Set up Grafana dashboard to read predicted trends as well, in separate charts
If you're interested in any of this, please let me know! I'd love to hear from you.
Conclusion
I hope you enjoyed reading my blog post about analyzing occupancy trends and embedded development. If you have any suggestions, comments, questions, or angry fists, you can email me at maesposito@wm.edu.